
Table of Contents
Quality metrics often compound across stages. If each stage keeps, passes, or preserves a fraction of the original work, the total result is a product.
Geometric mean can summarize those stage factors as one typical stage factor.
Quick answer
Use geometric mean for quality metrics when each value is a positive factor such as:
- Yield
- Retention
- Pass-through rate
- Survival rate
- Defect-free proportion
- Stage conversion factor
Do not use geometric mean for raw defect counts, ordinary scores, or mixed units.
Example: stage yield
Suppose a process has four stage yields:
| Stage | Yield factor | | --- | ---: | | Intake | 0.98 | | Processing | 0.96 | | Review | 0.99 | | Delivery | 0.97 |
The total pass-through factor is:
0.98 * 0.96 * 0.99 * 0.97 = 0.9035The geometric mean is:
0.9035^(1 / 4) = 0.9748That means the typical stage yield is about 97.48%.
Why arithmetic mean is not the full story
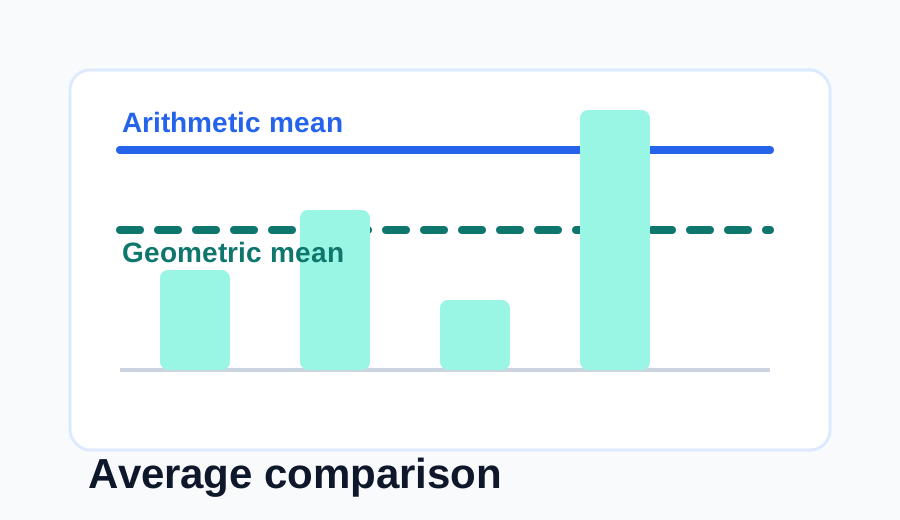
The arithmetic mean of the four stage yields is 97.5%, which is close in this example. But the geometric mean has the right interpretation: the repeated factor that produces the same total pass-through.
| Question | Better metric | | --- | --- | | What is the average stage factor? | Geometric mean | | What is the total process yield? | Product of factors | | How many defects occurred? | Defect count or defect rate | | Which stage is weakest? | Minimum factor or stage-level review |
Where quality metrics fit
| Use case | Example input | Geometric mean meaning | | --- | --- | --- | | Manufacturing yield | 0.99, 0.97, 0.96 | Typical stage yield | | Funnel retention | 0.80, 0.65, 0.50 | Typical retention factor | | Reliability chain | 0.999, 0.995, 0.997 | Typical component reliability | | Review pass-through | 0.92, 0.88, 0.95 | Typical pass factor |
Common mistakes
Averaging counts instead of factors
Do not enter raw defects such as 4, 9, 12 into geometric mean unless those values are meaningful multiplicative factors. Convert to rates or proportions first if that matches the question.
Hiding a weak stage
Geometric mean summarizes the typical factor, but one weak stage can still be the operational bottleneck. Always inspect individual stage values too.
Mixing rates with different denominators
Make sure each quality factor means the same thing before combining them.
Treating the result as total yield
The geometric mean is the typical stage factor. The total yield is the product of all stage factors.
Process chains and why products matter
Quality metrics often describe a chain. Work enters a process, passes through several stages, and only the surviving portion reaches the end. If each stage preserves 98%, 96%, and 97% of the work, the final yield is not the average of those percentages. It is the product.
That is why geometric mean is useful. It answers:
What single stage yield, repeated across all stages, would produce the same total pass-through?This is different from asking for total yield. Total yield uses the product of all stage factors. Geometric mean turns that product into a typical per-stage factor.
Full process example
Consider a five-stage process:
| Stage | Yield | Units entering | Units leaving | | --- | ---: | ---: | ---: | | Intake | 0.99 | 10,000 | 9,900 | | Validation | 0.95 | 9,900 | 9,405 | | Assembly | 0.97 | 9,405 | 9,122.85 | | Review | 0.92 | 9,122.85 | 8,393.02 | | Delivery | 0.98 | 8,393.02 | 8,225.16 |
The total yield is:
0.99 x 0.95 x 0.97 x 0.92 x 0.98 = 0.8225So about 82.25% of work reaches the end.
The geometric mean stage factor is:
0.8225^(1 / 5) = 0.9615That means the process behaves like five stages each yielding about 96.15%.
Total yield, typical stage yield, and bottleneck
Use all three views:
| Metric | What it tells you | | --- | --- | | Total yield | Final pass-through from start to finish | | Geometric mean | Typical stage factor | | Minimum stage yield | The weakest visible bottleneck |
The geometric mean is not a replacement for stage review. In the example above, the review stage at 0.92 deserves attention even though the typical stage yield is 0.9615.
Quality percentages versus defect counts
Defect counts are not geometric mean inputs by themselves. If one stage has 30 defects and another has 50 defects, those are counts. You can average counts arithmetically or convert them into rates if you know the denominators.
For example:
| Stage | Defects | Units inspected | Defect-free factor | | --- | ---: | ---: | ---: | | A | 20 | 1,000 | 0.98 | | B | 35 | 1,000 | 0.965 | | C | 10 | 1,000 | 0.99 |
Now the defect-free factors can be multiplied if stages form a chain. Without denominators and a process relationship, a geometric mean of raw defects would not answer a useful question.
When stages are not equal
Some stages may not represent equal process steps. A short automated check and a long manual review may not deserve equal weight. If one stage handles twice as many units or has a different exposure time, consider a weighted method or report stage metrics separately.
Geometric mean is most natural when each factor is one step in the same chain and each step has equal conceptual weight. If the process has branches, rework loops, or optional paths, a simple stage list may hide too much structure.
Dashboard wording
A good dashboard label might say:
Typical stage yield: 96.15%
Total process yield: 82.25%
Weakest stage: Review at 92%
Those three numbers tell a better story than one average. The geometric mean helps users understand the typical stage. The product shows the final result. The weakest stage points to action.
Using the calculator
Enter quality factors as decimals:
0.99, 0.95, 0.97, 0.92, 0.98If your source data is percentages, convert 99% to 0.99. If your source data is counts, convert to pass-through factors only if the process question supports it.
Use the Geometric Mean Calculator for the typical factor. Use the stage table in your own process data to keep the result tied to operational decisions.
Common user scenarios
Quality teams may use geometric mean in several practical settings:
| Scenario | Useful input | | --- | --- | | Manufacturing line | Stage yield factors | | Software release process | Pass rates for build, test, review, deploy | | Customer funnel | Retention factors from one step to the next | | Reliability chain | Component survival probabilities | | Document workflow | Acceptance factors at each review stage |
In each case, the values should represent a chain or comparable stage factors. If the values are unrelated quality scores, a different scorecard method may be clearer.
Improvement planning
The geometric mean can help set a practical target. If the current typical stage yield is 96.15% and the goal is 98%, users can ask which stages need improvement to move the typical factor.
But improvement planning should not optimize only the average. A bottleneck stage may be more important than a small increase in a strong stage. Use the geometric mean to summarize the process, then inspect the table to decide where action belongs.
For example, improving a 99% stage to 99.5% is helpful, but improving a 92% stage to 95% may change the total process yield more. The stage-level product makes that visible.
Reporting quality results
Use wording like:
The total process yield was 82.25%. The geometric mean stage yield was 96.15%, meaning the process behaves like five equal-yield stages at that level.This keeps total yield and typical stage yield separate. It also gives the user a mental model for the result.
Avoid reporting only “average yield” without saying whether it is arithmetic mean, geometric mean, or total pass-through.
Target-setting example
Suppose a process has stage yields:
0.99, 0.95, 0.97, 0.92, 0.98The weakest stage is 0.92. If that stage improves to 0.96 while the others stay the same, total yield improves noticeably:
0.99 x 0.95 x 0.97 x 0.96 x 0.98The geometric mean stage yield also rises. This is useful for planning because users can test which stage improvement changes the overall process most.
Do not use the geometric mean only as a score. Use it as a way to ask better operational questions:
- Which stage is pulling the product down?
- What target stage factor would meet the total-yield goal?
- Is improvement spread evenly or concentrated in one bottleneck?
- Should the process be redesigned instead of optimizing one step?
When total yield is the headline
If the user cares about final output, total yield should be the headline. If the user cares about typical stage behavior, geometric mean should be the headline. In many operations reports, both belong together.
That distinction keeps the article useful for real process decisions, not just formula practice.
What users should do next
After calculating a typical stage factor, users should look for the action behind the number. If every stage is similar, the process may need broad improvement. If one stage is much weaker, the best next step is likely a bottleneck review.
The geometric mean should make process conversations clearer. It gives one compact number for the typical stage, but the stage table tells the team where to work.
For repeated reporting, track the same stage factors over time. A rising geometric mean suggests the typical stage is improving. A flat geometric mean with one worsening stage may signal that gains elsewhere are hiding a new problem.
FAQ
Can quality percentages be entered directly?
Convert percentages to factors first. A 98% yield becomes 0.98.
Is geometric mean better than arithmetic mean for quality metrics?
It is better when the metrics compound across stages. Arithmetic mean can still be useful for a quick descriptive summary.
What if one stage has zero yield?
A true zero means the full chain output is zero. If zero means missing data, clean the data before calculating.
Related calculators
Use the Geometric Mean Calculator for positive stage factors such as yield, pass-through, and retention ratios. Use the Harmonic Mean Calculator for average rates measured over equal distances or units. Use Geometric Mean vs Arithmetic Mean when deciding whether your metric is additive or multiplicative.