
Table of Contents
Ratios compare one quantity with another. Because they are relative values, geometric mean is often a better summary than arithmetic mean when the ratios multiply, chain, or describe proportional change.
The key word is often. Some ratios are rates, and rates may need harmonic mean instead.
Quick answer
Use geometric mean for ratios when the ratios behave like factors.
Examples include:
- Fold changes
- Relative performance scores
- Index relatives
- Stage multipliers
- Growth factors
Use harmonic mean when the ratios are rates over equal units, such as speed, price per unit, or units per hour.
Example: chained process ratios
Suppose three stages have ratios:
| Stage | Ratio | | --- | ---: | | A | 1.10 | | B | 0.95 | | C | 1.20 |
The total factor is:
1.10 * 0.95 * 1.20 = 1.254The geometric mean ratio is:
1.254^(1 / 3) = 1.078That means the typical stage factor is about 1.078.
Why arithmetic mean can distort ratios
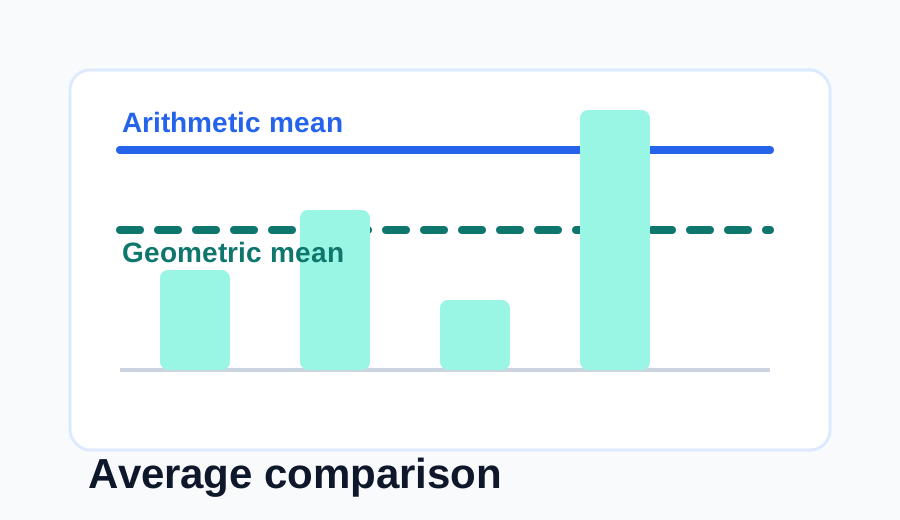
Arithmetic mean adds ratios. But chained ratios multiply.
| Ratios | Arithmetic mean | Geometric mean | Better interpretation | | --- | ---: | ---: | --- | | 1.10, 0.95, 1.20 | 1.083 | 1.078 | Typical multiplying factor | | 0.50, 2.00 | 1.25 | 1.00 | The ratios cancel as factors |
The second row is the clearest example. A factor of 0.50 followed by 2.00 returns to the starting value. Geometric mean correctly gives 1.00.
Ratio or rate?
Not every ratio should use geometric mean.
| Input type | Better average | Example | | --- | --- | --- | | Multiplying factor | Geometric mean | Fold changes: 1.2x, 1.5x, 0.9x | | Growth ratio | Geometric mean | Revenue relative to last year | | Speed | Harmonic mean for equal distances | 30 mph and 60 mph | | Price per unit | Harmonic mean for equal budgets | Dollars per item | | Ordinary score ratio | Depends on question | Score relative to baseline |
For the full distinction, read Geometric Mean vs Harmonic Mean.
Common mistakes
Averaging reciprocal ratios with arithmetic mean
If one ratio is 0.5 and another is 2.0, the arithmetic mean is 1.25 even though the combined effect returns to 1.0.
Mixing different baselines
Ratios should mean the same kind of relative comparison before you average them.
Using geometric mean for rates automatically
Rates often need harmonic mean or a weighted average. Check what the denominator represents.
How to classify a ratio before averaging
Before choosing an average, describe what the ratio means in a sentence. That sentence usually tells you whether geometric mean fits.
Good geometric-mean sentence:
Each ratio multiplies the previous value to create the next value.Good harmonic-mean sentence:
Each ratio is a rate per shared unit, such as miles per hour or dollars per item.Good weighted-average sentence:
Each ratio comes from a different denominator size, so larger denominators should count more.If you cannot write a clear sentence, do not average the ratios yet. First identify the numerator, denominator, baseline, and user question.
Worked example: relative performance ratios
Suppose four teams are measured against the same baseline:
| Team | Relative output | | --- | ---: | | A | 1.30 | | B | 1.10 | | C | 0.90 | | D | 1.05 |
Each value is a factor relative to baseline. A value of 1.30 means 30% above baseline. A value of 0.90 means 10% below baseline.
The geometric mean is:
(1.30 x 1.10 x 0.90 x 1.05)^(1 / 4)The result is the typical relative performance factor. If the result is 1.075, the group is about 7.5% above baseline on a multiplicative basis.
The arithmetic mean may be close, but it does not preserve the product of the ratios. If the ratios represent linked factors or proportional performance, the geometric mean has the clearer interpretation.
Reciprocal pairs are the clue
The pair 0.5 and 2.0 is the simplest test. If those two ratios should cancel each other, geometric mean is probably appropriate.
0.5 x 2.0 = 1.0The geometric mean is:
(0.5 x 2.0)^(1 / 2) = 1.0The arithmetic mean is:
(0.5 + 2.0) / 2 = 1.25If your use case says the combined effect should return to baseline, the arithmetic mean is telling the wrong story. This pattern appears in fold changes, scale factors, and relative performance ratios.
Ratio averaging decision table
| Ratio type | Example | Better method | | --- | --- | --- | | Fold change | 1.5x, 0.8x, 1.2x | Geometric mean | | Stage multiplier | 0.95, 1.10, 0.98 | Geometric mean | | Speed | 30 mph, 60 mph | Harmonic mean for equal distance | | Price per unit | 2 dollars/item, 4 dollars/item | Harmonic or weighted method | | Conversion rate by traffic source | 2%, 5%, 9% | Weighted average if traffic differs | | Score relative to baseline | 1.2, 0.9, 1.1 | Geometric mean if scale is multiplicative |
The denominator is the important clue. If the denominator represents exposure or sample size, equal averaging can mislead. If the ratio is a multiplying factor, geometric mean is usually more natural.
Weighted ratios
Ratios from different sample sizes often need weights. Suppose one campaign has a conversion rate of 10% from 100 visits, and another has 2% from 10,000 visits. A simple average gives 6%, but most users experienced the second campaign’s rate. A weighted average is more honest.
Geometric mean does not solve sample-size weighting by itself. It answers the factor question. If your ratios are both factors and have different importance, you may need a weighted geometric mean. In ordinary site use, report the weights or keep the factors separate.
How to report a ratio geometric mean
Use factor language:
The geometric mean ratio was 1.078, meaning the typical stage multiplied the value by about 1.078.If the ratio is relative to baseline, convert it:
The typical relative performance was about 7.8% above baseline.If the ratio is below 1:
The typical factor was 0.94, meaning about 6% below baseline per stage.Clear wording matters because a ratio result can otherwise look like a plain score.
Calculator workflow
Use the Geometric Mean Calculator when the ratios are positive multiplying factors. Enter values such as:
1.30, 1.10, 0.90, 1.05Use the Harmonic Mean Calculator when the ratios are rates over equal units. Use Which Average Should I Use? when the denominator or weighting is unclear.
Questions to ask before using ratios in a report
Ratios are easy to calculate and easy to misuse. Ask these questions before reporting one average ratio:
- Do all ratios use the same baseline?
- Are all ratios positive?
- Does a ratio below 1 mean underperformance, shrinkage, or loss?
- Does a ratio above 1 mean improvement, growth, or expansion?
- Are the ratios equally important?
- Would reciprocal ratios such as 0.5 and 2.0 be expected to cancel?
If the reciprocal test makes sense, geometric mean is often the right center. If denominators or sample sizes dominate the interpretation, use weights or another method.
Reporting examples
Good wording:
The geometric mean of the stage ratios was 1.078, so the typical stage increased the value by about 7.8%.Good wording for below-baseline ratios:
The geometric mean ratio was 0.94, indicating a typical 6% decrease from baseline.Weak wording:
The average ratio was 1.078.The weak wording does not say what kind of average was used or what the ratio means.
Edge cases
A ratio of zero means the product becomes zero. That may be meaningful in a chain where output completely stops, but it may also signal missing data or a broken denominator. A negative ratio usually does not belong in ordinary geometric mean unless the context has a specialized mathematical interpretation.
Ratios with changing baselines also need care. A value of 1.10 against one baseline and 1.10 against another baseline may not be comparable if the baselines represent different things.
A visual way to think about ratio chains
Think of multiplying ratios as a path:
Start x ratio 1 x ratio 2 x ratio 3 = EndThe geometric mean asks what one ratio could replace every step:
Start x r x r x r = EndThis makes the result easier to explain. A geometric mean ratio of 1.078 means the chain behaves like repeated steps of 1.078.
Ratio examples that should stay separate
Some ratios should not be combined even if they are positive:
| Ratio | Why it may need separate treatment | | --- | --- | | Revenue per employee | Business productivity ratio | | Miles per gallon | Efficiency rate | | Defects per unit | Quality rate | | Return factor | Investment multiplier |
These ratios may all be positive, but they do not share one interpretation. A single geometric mean across them would be hard to explain. Keep them separate or normalize them into a common framework first.
Final ratio checklist
Before using the calculator, confirm:
- The ratios are positive.
- They share the same baseline or interpretation.
- They multiply, chain, or describe proportional change.
- The result can be explained as a typical factor.
- Rates and weighted ratios have been ruled out.
If all five checks pass, geometric mean is likely a good fit.
What makes a ratio result useful
A ratio average is useful only when the user can act on it. If the geometric mean ratio is above 1, ask what is creating the improvement. If it is below 1, ask which factor is pulling the product down. If it is near 1, ask whether high and low ratios are canceling each other.
This is why the individual ratios should stay visible. The geometric mean gives the typical factor, but the table explains the path. For business, science, and operations users, that path is where the decision usually lives.
When in doubt, report the geometric mean with the original ratios and a short interpretation. A number without the source ratios is easy to misread.
FAQ
Can ratios below 1 be used?
Yes. Positive ratios below 1 are valid and often represent decline, shrinkage, loss, or underperformance.
Can a ratio be zero?
A zero ratio makes the product zero. Decide whether that is a true zero or a data-quality issue before calculating.
Is geometric mean always best for ratios?
No. It is best when ratios multiply or describe proportional change. Rates and reciprocal quantities may need harmonic mean.
Related calculators
Use the Geometric Mean Calculator when ratios multiply or chain together. Use the Harmonic Mean Calculator when your ratios are rates, speeds, or prices per unit. Use Which Average Should I Use? when the ratio type is unclear.